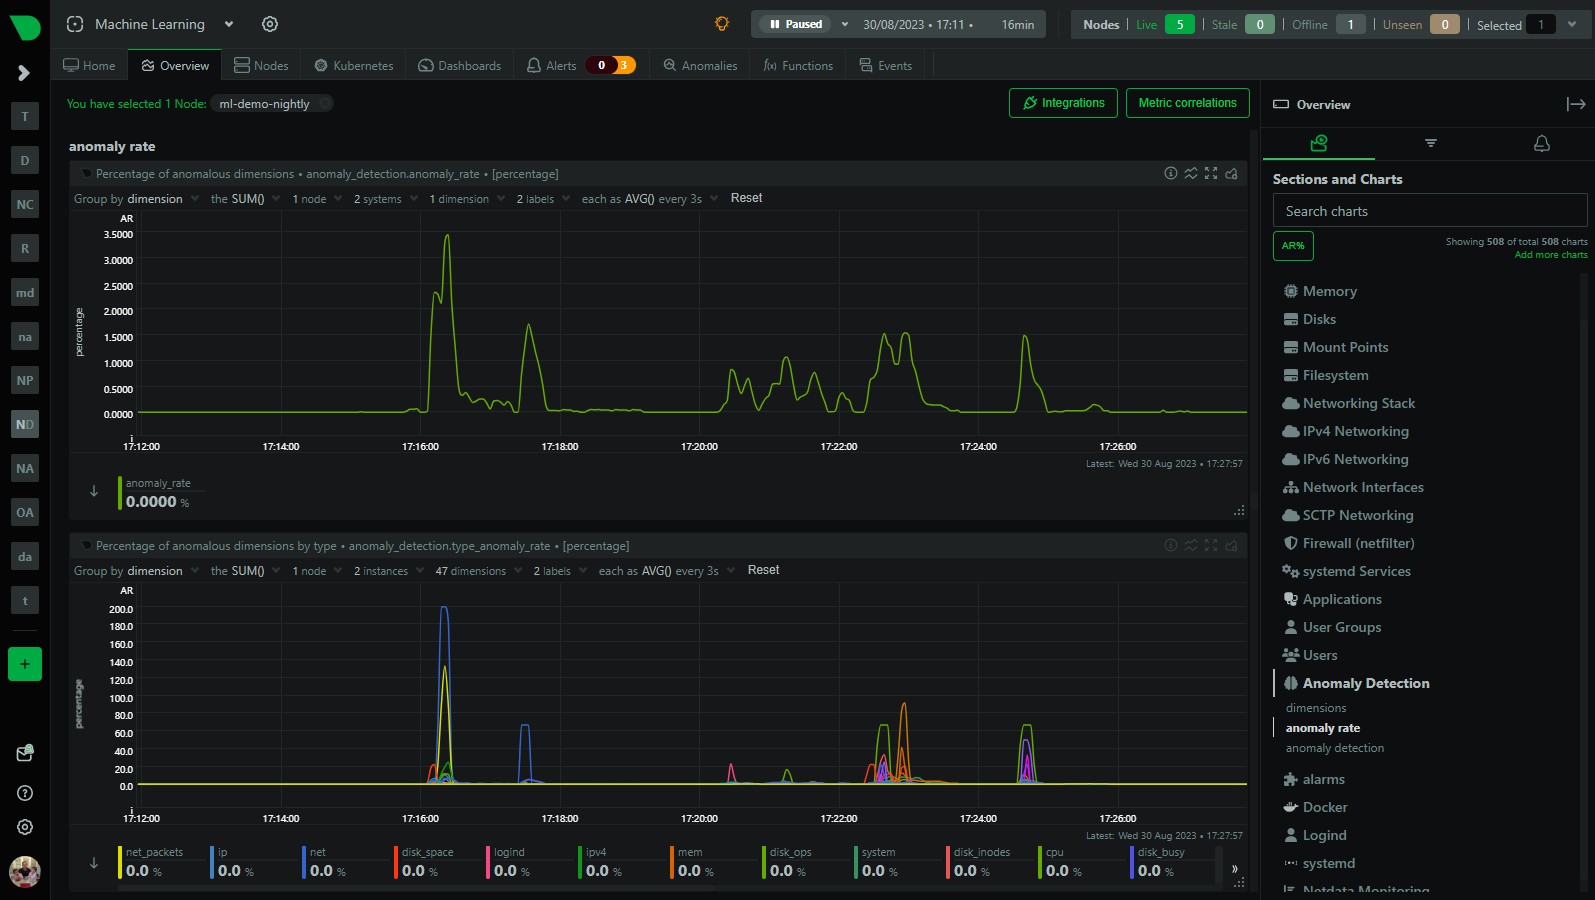
We have recently added a more detailed anomaly rate chart to Netdata that breaks out the overall node anomaly rate by type, this lets you more easily see what parts of your infrastructure might be experiencing an uptick in anomalies when you see the overall node anomaly rate increase.
17 posts tagged with "machine-learning"
View All TagsNetdata & Ansible example: ML demo room
We are always trying to lower the barrier to entry when it comes to monitoring and observability and one place we have consistently witnessed some pain from users is around adopting and approaching configuration management tools and practices as your infrastructure grows and becomes more complex.
To that end, we have begun recently publishing our own little example ansible project used to maintain and manage the servers used in our public Machine Learning Demo room.
This post introduces this project as a somewhat simple example of using Ansible with Netdata. Read on to learn more, but more importantly feel free to explore the repo and see how it all hangs together.
How Netdata's ML-based Anomaly Detection Works
How does Netdata's machine learning (ML) based anomaly detection actually work? Read on to find out!
Transforming Monitoring with a Machine Learning-First Approach
Unlocking the full potential of monitoring through ML integration, anomaly detection, and innovative scoring engines.
Netdata's AI Insights & Rapid Diagnostics
Introduction to Netdata's new visualisation providing AI Insights, supporting Rapid Diagnostics.
Anomaly Rates in the Menu!
The menu (on the overview or single node tab) now has an anomaly rate button built into it that, for the entire visible window or a highlighted time range, shows the maximum chart anomaly rate within each section.
Read on to learn more about this new feature!
Extending Netdata's anomaly detection training window
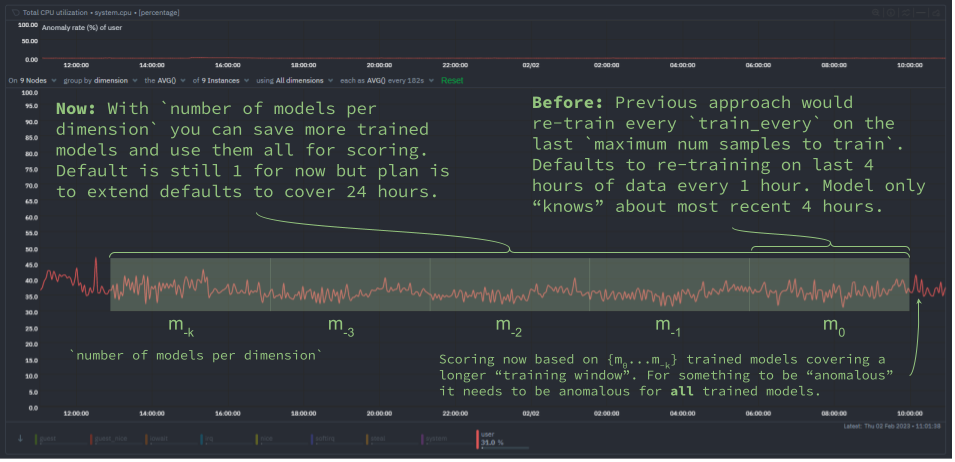
We have been busy at work under the hood of the Netdata agent to introduce new capabilities that let you extend the "training window" used by Netdata's native anomaly detection capabilities.
This blog post will discuss one of these improvements to help you reduce "false positives" by essentially extending the training window by using the new (beautifully named) number of models per dimension
configuration parameter.
Data Collection Strategies for Infrastructure Monitoring – Troubleshooting Specifics
How Netdata’s Machine Learning works
Following on from the recent launch of our Anomaly Advisor feature, and in keeping with our approach to machine learning, here is a detailed Python notebook outlining exactly how the machine learning powering the Anomaly Advisor actually works under the hood.
Anomaly rate in every chart
Metric Correlations on the Agent
As of v1.35.0
the Netdata Agent can now run Metric Correlations (MC) itself. This means that, for nodes with MC enabled, the Metric Correlations feature just got a whole lot faster!
Introducing Anomaly Advisor – Unsupervised Anomaly Detection in Netdata
Today we are excited to launch one of our flagship ML assisted troubleshooting features in Netdata – the Anomaly Advisor.
The Anomaly Advisor builds on earlier work to introduce unsupervised anomaly detection capabilities into the Netdata Agent from v1.32.0 onwards.
CNCF Live: Power up your machine learning – Automated anomaly detection
Our Approach to Machine Learning
There is a lot of buzz in the world of machine learning (ML) and as a layperson it can be hard to keep up with it all. Therefore, we decided to write down some of our thoughts and musings on how we are approaching ML at Netdata.